Examples
Contents
Examples#
Below you can find some useful examples of code snippets to be used with DLUP.
Use DLUP CLI to tile all WSIs in a directory#
Below is an example of a .sh script that can be used to tile all WSIs in a directory, saving the tiles in a similar directory structure as the directory structure of the source.
This script finds all files of a given extension (e.g. .svs for TCGA) in a given directory, tiles each WSI according to the given configuration, and saves it in a similar directory structure.
If given file paths to the directories are absolute, you can run the .sh script from anywhere. Otherwise, run it from the proper directory.
This simple script can then be run with
bash tile_all_wsis_in_directory.sh \
source_directory \
extension \
output_directory \
mpp \
tile_size \
foreground_threshold
e.g.
bash tile_all_wsis_in_directory.sh \
/absolute/or/relative/path/to/directory/containing/wsis \
.svs \
/absolute/or/relative/path/to/directory/to/save \
2 \
2048 \
0.8
#!/bin/bash

SOURCE_DIRECTORY=$1 # "/absolute/or/relative/path/to/directory/containing/wsis"
LEN_SOURCE_DIRECTORY=${#SOURCE_DIRECTORY}
EXTENSION=$2 # e.g. .svs
OUTPUT_DIRECTORY=$3 # "/absolute/or/relative/path/to/directory/to/save"
MPP=$4 # e.g. 2
TILE_SIZE=$5 # e.g. 2048
FOREGROUND_THRESHOLD=$6 # e.g. 0.8

# If the input dir looks like
# SOURCE_DIRECTORY
# ├── patient_dir_1
# │    ├── wsi_1.svs
# │    └── wsi_2.svs
# ├── patient_dir_2
# │    ├── wsi_1.svs
# └──  └── wsi_2.svs

# The output dir would look like this (depending on the given parameters, used WSIs, and version of DLUP)

# TARGET_DIRECTORY
# ├── patient_dir_1
# │    ├── wsi_1
# │    │   ├── mask.png
# │    │   ├── thumbnail.png
# │    │   ├── thumbnail_with_mask.png
# │    │   ├── tiles
# │    │   │   ├── 1_1.png
# │    │   │   ...
# │    │   │   └── 5_3.png
# │    │   └── tiles.json
# │    └── wsi_2.svs
# │    │   ├── mask.png
# │    │   ├── thumbnail.png
# │    │   ├── thumbnail_with_mask.png
# │    │   ├── tiles
# │    │   │   ├── 1_1.png
# │    │   │   ...
# │    │   │   └── 4_5.png
# │    │   └── tiles.json
# └── patient_dir_2
#      ├── wsi_1.svs
#      │   ├── mask.png
#      │   ├── thumbnail.png
#      │   ├── thumbnail_with_mask.png
#      │   ├── tiles
#      │   │   ├── 1_1.png
#      │   │   ...
#      │   │   └── 8_8.png
#      │   └── tiles.json
#      └── wsi_2.svs
#          ├── mask.png
#          ├── thumbnail.png
#          ├── thumbnail_with_mask.png
#          ├── tiles
#          │   ├── 1_1.png
#          │   ...
#          │   └── 6_5.png
#          └── tiles.json

find $SOURCE_DIRECTORY -name "*$EXTENSION" | while read line
do
    RELATIVE_DIR=${line:$LEN_SOURCE_DIRECTORY+1} # Strip the source directory from the found file path and the /
    RELATIVE_DIR_WITHOUT_FILE_EXTENSION=${RELATIVE_DIR%.*} # Strip the extension from the found file path

    dlup wsi tile \
    --mpp $MPP \
    --tile-size $TILE_SIZE \
    --foreground-threshold $FOREGROUND_THRESHOLD \
    $line \
    $OUTPUT_DIRECTORY/$RELATIVE_DIR_WITHOUT_FILE_EXTENSION
    # Pass the found filepath as input
    # Save the output in the same tree structure as source directory
done
Working with the SlideImage and creating a TiledROIsSlideImageDataset#
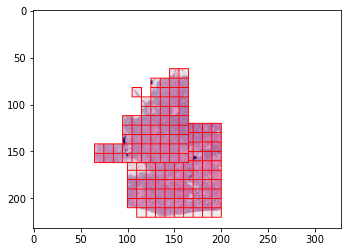
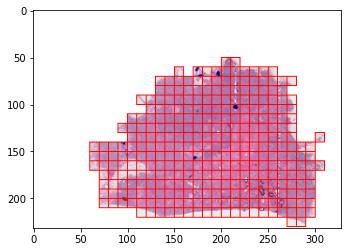
Below you can find code snippets that show how to work with the DLUP SlideImage class, and create a tiled dataset on the fly without any preprocessing. The visualizations show the result of the automatic masking and thresholding.
from dlup.data.dataset import TiledROIsSlideImageDataset
from dlup import SlideImage
import matplotlib.pyplot as plt
from PIL import Image, ImageDraw
import numpy as np
from dlup.background import get_mask

INPUT_FILE_PATH = "TCGA-B6-A0IG-01Z-00-DX1.4238CB6E-0561-49FD-9C49-9B8AEAFC4618.svs"
slide_image = SlideImage.from_file_path(INPUT_FILE_PATH)

TILE_SIZE = (10, 10)
TARGET_MPP = 100

# Generate the mask
mask = get_mask(slide_image)
scaled_region_view = slide_image.get_scaled_view(slide_image.get_scaling(TARGET_MPP))

dataset = TiledROIsSlideImageDataset.from_standard_tiling(INPUT_FILE_PATH, TARGET_MPP, TILE_SIZE, (0, 0), mask=mask)
output = Image.new("RGBA", tuple(scaled_region_view.size), (255, 255, 255, 255))

for d in dataset:
    tile = d["image"]
    coords = np.array(d["coordinates"])
    box = tuple(np.array((*coords, *(coords + TILE_SIZE))).astype(int))
    output.paste(tile, box)
    draw = ImageDraw.Draw(output)
    draw.rectangle(box, outline="red")

output.save("dataset_example.png")
grid1 = Grid.from_tiling(
    (100, 120),
    size=(100, 100),
    tile_size=TILE_SIZE,
    tile_overlap=(0, 0)
)

grid2 = Grid.from_tiling(
    (65, 62, 0),
    size=(100, 100),
    tile_size=TILE_SIZE,
    tile_overlap=(0, 0)
)

dataset = TiledROIsSlideImageDataset(INPUT_FILE_PATH, [(grid1, TILE_SIZE, TARGET_MPP), (grid2, TILE_SIZE, TARGET_MPP)], mask=mask)


output = Image.new("RGBA", tuple(scaled_region_view.size), (255, 255, 255, 255))

for i, d in enumerate(dataset):
    tile = d["image"]
    coords = np.array(d["coordinates"])
    print(coords, d["grid_local_coordinates"], d["grid_index"])
    box = tuple(np.array((*coords, *(coords + TILE_SIZE))).astype(int))
    output.paste(tile, box)
    draw = ImageDraw.Draw(output)
    draw.rectangle(box, outline="red")

output.save("dataset_example2.png")